
Motivation
Bangalore has seen a spurt in the instances of citizen groups taking the lead in various interventions in the city with regards to public space cleanliness, quality of the water bodies, and waste-water management solutions. Being the nation’s hub for technology-based services, it has also amassed a young population that sees the importance of better-managed cities. Many neighborhoods within the city are becoming epicenters for annual movements to build awareness around issues of civic engagement, participation, and responsibility towards tasks like public health, and waste and water management.
While many of these people have contributed actively to the public discourse around civic duty and public space improvements, there has been a general disconnect between the authorities in the city who are responsible for the upkeep, and the citizen brigades that undertake the task above and beyond their regular routines. This process, in the case of waste management and disposal, hasn’t yielded any significantly long lasting results primarily since none of the interventions are designed to create a cycle of self-sufficiency, but rather take on the form of a political statement to the authorities in charge.
This project is intended to create an interface where interventions designed to assist a catchment’s ability to improve water quality and restore much of its natural flow while providing an essential array of ecological services. This imagined interface is one way to bring scientifically tested facts about locating these interventions, assembled in a format most suitable for decision-making; a web interface that lets the user view a reimagined version of the city, with all the possible solutions visualized, enabling them to make decisions around which civic organizations can rally, and around which negotiations can be held between the citizens and the municipal bodies.
The Task
The task ahead of us is briefly outlined in the following flow chart.

It begins with the process of acquiring satellite imagery, digital elevation models, and vector datasets that contain information on urban infrastructure, and land ownership in the city. The first two are acquired from USGS for free at a resolution of 30m, but we would soon incorporate 5m resolution imagery acquired from the Indian Remote Sensing Centre, The vector data sets are obtained from OpenStreetMaps.
Since I wanted to start with just a catchment within the city of Bangalore, I decided that the best way to cover the city would by creating rectangular tiles around the various catchments so that eventually they would sew together like a large jigsaw. I originally wanted to clip all outputs to a catchment boundary, but clipping raster datasets resulted in misaligned pixels that would’ve created an issue during map algebra. This occurred due to a bug about which I need to read further about. Hence, I decided to work with a simpler geometry to build this the output.
Once deciding on the extent, the task is to reproject all the datasets to WGS84 – UTM 43N, best-suited projection got this region of India.
With help from Prof. Waddell, I was able to find sources for information on what exactly is the process of reading raster information on python and means of efficient data processing via slicing raster datasets. I was also introduced to the libraries like gdal, ogr which contain many tools to read, write raster datasets. Libraries like spectral, scipy.ndimage were also used for more complex raster calculations and classification. These libraries helped recreate the slope and the land use land cover categories for the study area.


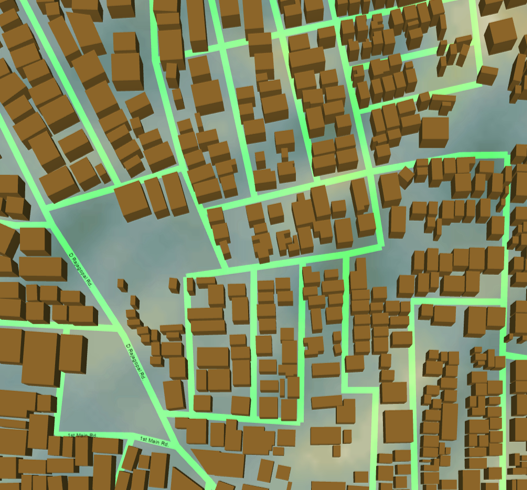
To provide context to those two images, the following image shows flow of water overlayed on elevation to give an idea of the valley. The LULC output matches quite well with the existing city extents in this region, although I’m yet to come up with a way to gauge how accurate is the LULC cover made by k-means methods. I shall be looking into DBSCAN clustering algorithms too to see if they provide a more accurate classification raster.

Using these libraries, I attempted to create a slope raster, a topographical wetness index raster, land cover raster which would act as a proxy for surface level soil type. The library also has tools to rasterize vector data. I used this tool to convert roads in the study area to a raster dataset, but it kept giving me erroneous results. I linked this issue to the fact that I was creating 30m rasters in areas that have a high density of roads. I decided to reduce the cell size to 10m because I wanted the raster image to be as accurate a depiction of the real scenario. This size also keeps the error small, if I were to resample my other datasets from 30m to 10m.
Having obtained raster versions of my vector files, I intend to conduct proximity analysis on the to develop a new raster that assigns pixels value based on their location from the pixel that is marked as 1, 1 indicating the presence of physical infrastructure as opposed to 0 indicating the non-vector space in the rasterized vector layer.
A common function is written to “make raster”; essentially feed all input criteria like transformation, extent, origin coordinates, pixel size, stored data type, from a dummy raster. Other functions used throughout the process is one of making slices, although that was later rendered moot with the introduction of scipy modules.
Challenges
This project is a work in progress. I would want a working tool created at the end of my degree here at the university. While the overall process is outlined previously. The following tasks are yet to conducted or need to be debugged:
- Clipping rasters, while enabling a snapping layer to ensure aligned pixels. This is doable on ArcMap, but QGIS or the python code throw up various types of errors.
- Fixing proximity analysis code to ensure a successful output. The current code stops running during the process of rasterization of the input vector file. This might be either to the earlier stated cause of too big a resolution. The error itself is unclear and reads about missing object as an input for a function in the rasterization process, even though the value parsed is an object.
- Reclassification tool to regroup continuous raster information into discrete weights runs without error in some cases but creates an empty raster. Need to debug this code.
- Learn to add rasters as tiles in the tangram interface
- Reprojection of Raster is currently done using QGIS. Need to find a suitable way to automate the process of clipping datasets from its raw file, and reprojecting it with no loss of pixels values on the edges of these boundaries.
- Reproject raster dataset. Vector reprojection is doable.
- Explore the possibility of Mapbox as an alternative to Mapzen’s tangram as a base for building the interactive web map.
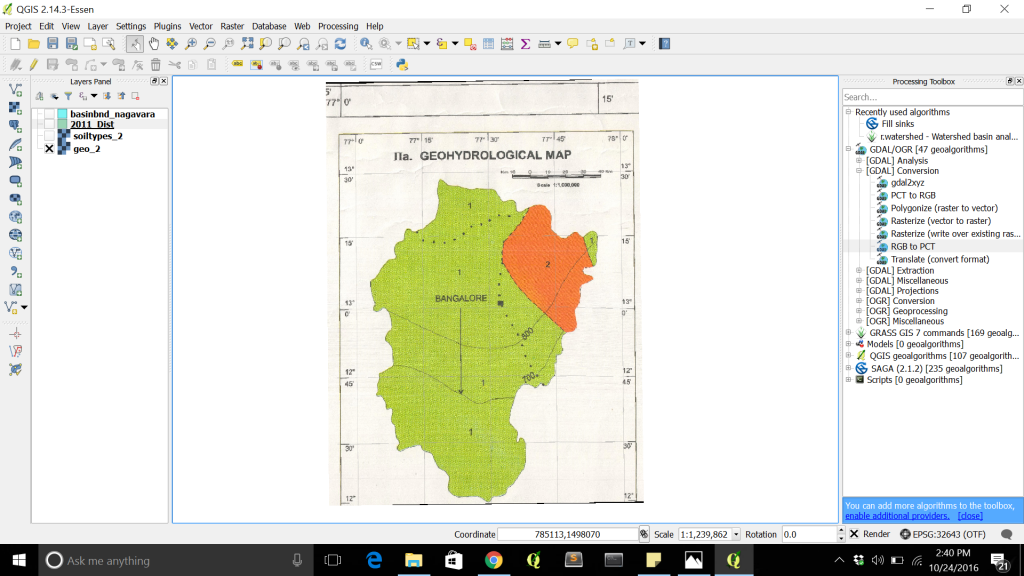
Some issues with data are always prevalent. To give an example above is a soil map that is supposed to supplement this research, but the image provided gives to CRS to work with, and after multiple iterations, there is still significant error associated while georeferencing
Acknowledgement
Professor Waddel and Geoff Boeing at the UC, Berkeley, need to be thanked for introducing me to python and its capabilities. From working on GIS software to understanding the underlying code that makes the magic happen, this has been the most useful addition to my bag of professional tips and tricks. The book Geoprocessing with Python was a useful source to understand the underlying process behind the code that I used. The online community at gis.stackexchange were most supportive, albeit presumptive of my knowledge in this field.