Hazards and Vulnerability Institute: Social Vulnerability in California by census tract
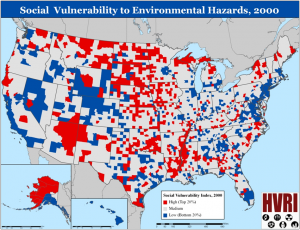
There are certain social factors that are directly related to a population’s vulnerability in the context of climate change. This assumption is central to the work done by the Hazards and Vulnerability Research Institute (HVRI) at the University of Southern Carolina (USC) in developing a social vulnerability index for evaluating levels of vulnerability for census tracts, and census block groups, across the United States. The HVRI is widely regarded as the leading institution publishing data on social vulnerability to climate change, and designed a series of publicly available tools for conducting vulnerability assessments. The Social Vulnerability Index (SoVI ®) “is a comparative metric that facilitates the examination of the differences in social vulnerability” across geographies. It was designed as a tool for policy makers and practitioners as a way of understanding disparities in capacity to respond to environmental hazards and ultimately to understand “where resources might be used most effectively to reduce social vulnerability.”
The Institute first published SoVI data based on 2000 Census Data across the United States. They identified the following set of indicators:
• Socioeconomic status
• Age
• Development
• Rural agriculture
• Race & Gender (combined)
• Race (independent)
• New Immigrants
• Ethnicity
• Gender (independent)
• Infrastructure Employment
• Economic Dependence
Following the release of the 2000 SoVI scores, the HVRI worked to develop a more targeted set of social vulnerability indicators. Specifically, HVRI sought to integrate an evolved understanding of vulnerability theory to account for the constraints posed by family structure, linguistic barriers, vehicle access, medical disabilities, and health care access in the context of environmental disaster preparation and recovery. Following this logic, the 2006-2010 SoVI Scores (“SoVI 2010”), include more census data related to: Race and Class, Wealth, Age, Ethnicity, Nursing Home Residents, and Employment in Service Industries. The HVRI collected data for these variables from the five-year American Community Survey estimates compiled by the U.S. Census Bureau. Data are also obtained from the 2007 one-year American Community Survey, the Geographic Names and Information System (GNIS), and model-based Small Area Health Insurance Estimates (SAHIE) published by the U.S Census Bureau, and then used to represent the identified factors. The table below, provided by Dunning et al, breaks down the 30 variables and indicates which are newly incorporated (i.e. absent from the SoVI 2000 data).
In order to allow for comparative analysis of each census tract’s vulnerability, the HVRI standardizes each of these factors and places them into a principal components analysis, intended to “reduce the initial set of variables into a smaller set of statistically optimized components.” From there, “adjustments are made to the components’ cardinality (positive (+) or negative (-)) to insure that positive component loadings are associated with increased vulnerability, and negative component loadings are associated with decreased vulnerability. Once the cardinalities of the components are determined, the components are added together to determine the numerical social vulnerability score for each [geography].”[1]The weighting of each factor takes into account the component’s influence on vulnerability by the HVRI’s standards. Geographies with the lowest SOVI Scores, that make up the lowest 20% of all scores (in the range of -15 to -2.0%), can be understood to represent areas with the lowest social vulnerability in the context of climate change challenges, and in this case, in the face of sea level rise.[2] Geographies with the highest SoVI scores (highest 20%) are conversely the most socially vulnerable. The HVRI categorizes the mid-range scores that fall between these two extremes as “medium risk” areas.
Instructions on how to calculate this version of SoVI® can be found here.
Pacific Institute: Social Vulnerability in California by census tract
The Pacific Institute developed a Social Vulnerability score based on a similar structure to the SoVI criteria, for the specific context of California. The Pac Institute’s SOVI score rates Census Tracts on a social vulnerability scale from -2 to +2 based on the following factors:
- Living Alone over 65
- Population under 18
- Renters
- Households speaking little English
- People of Color
- Low Income
- Population w/out High School Diploma
- Living in Group Quarters
- Unemployed
- Women giving birth last 12 months
- Outdoor Workers
- Foreign Born
- Lack Access to Grocery Stores
- Overweight/Obese Youth
- Impervious Land Cover
- Treeless Area
- Households without a vehicle
- Pre-term Birth Rate
- Households without Air conditioner
These factors were taken together to create a single composite indicator, or a social vulnerability index, which was calculated on the census tract level based on data collected from 2005-2009. To do this, the researches used a statistical method to transform each variable by calculating z-scores (a measurement of an observation’s distance from the average) in the same fashion that was deployed by the University of Southern California in developing SoVI. Data sources included the American Community Survey for 2005-2009, as well as work done by A.M Ortega Hinojosa[1] and E Roberts[2].
While the institute recognizes that these factors are note entirely comprehensive, and that there may be additional considerations that extend beyond scope of their analysis, they feel that these factors reflect the indicators relevant to social vulnerability to climate change in California for which there are reliable data.
[1] Ortega Hinojosa, A. M. 2011. Digital data files sent by email. Doctoral Candidate, UC Berkeley School of Public Health, Division Environmental Health Sciences.
[2] Roberts, E. 2011a. Analysis of California Energy Commission survey of California household air conditioning unit. Personnel Communication, Research Manager, California Environmental Health Tracking Program, California Department of Public Health
[1] “Social Vulnerability Index for the United States.”