What makes LA traffic one of the worst in history and what are the city’s future plans in order to reduce congestion?
Introduction
Since the major development that took place in 1900’s, Los Angeles has always spurned a dependence on automobiles for residents to travel. The city’s geographic development is the reason for this; a bunch of “satellite” like clusters with spaces between residential areas and non-residential areas. This adds to LA being a popular vacation spot that boasted the luxury of purely incredible amounts of space. Today, Los Angeles is obviously much denser than it was in the early 1900’s. The 101, 5, I-10, and 405 freeways that run through LA dictate some of LA’s busiest areas. In Los Angeles, it’s normal for a predicted 15 minute trip to take at least 30 minutes. The significance in this is that longer commute times have been proven to be correlated with lower mental health. More time spent commuting means less personal downtime, and in many ways is an inhibition of socioeconomic mobility, due to the vehicle mobility issue. Furthermore, increased traffic congestion may lead to more collisions, ultimately affecting traffic safety. Given how the city’s population has been strictly increasing, the aforementioned issues can only be getting more dire. In this story map, we look at how the population has been growing, the effects of land use, and commuter data to better understand why LA traffic congestion is one of the worsts and what future changes are necessary in order to increase vehicle-travel mobility.
Population Density Over Time
Top: 2000 | Bottom: 2010
The most significant factor in causing the traffic congestion in Los Angeles is the rapidly increasing change in population. In the above maps, it can be seen that the population is not only growing; the city population growing from 3.703 million to 3.796 million between 2000 and 2010. The above choropleth maps have been coded using the same color palette, deeper red signifying denser populations while lighter, pink areas signify less dense areas. Just a casual glance at the maps side by side, it is obvious that the 2010 map is much darker and redder than its 2000 counterpart, indicating sheer population growth. In particular, the south and east portion of LA really fill out and become much more dense.
Where are businesses most dense in LA and where are people living?
With Los Angeles being a strong contributor to the U.S. economy, a large part of what makes up the city is their commercial/industrial space. In the land use map of the city generated in 2018, we observe that there is a high density of commercial/industrial space clustered together in Downtown LA, while there is very little residential space in that area. This makes housing costs to be significantly higher in the center and because of that, most workers are likely to live further away in the outskirts of the city and have to commute to get to work every day. Ultimately, this will create conflicts as more collisions will occur due to the large workforce commuting in and out of the same general area and similar times of the day.

Image Source: https://www.trulia.com/real_estate/Los_Angeles-California/
Inflow and Outflow of Workers

Image Source: Screenshot from OnTheMap.census.gov

Image Source: Screenshot from OnTheMap.census.gov
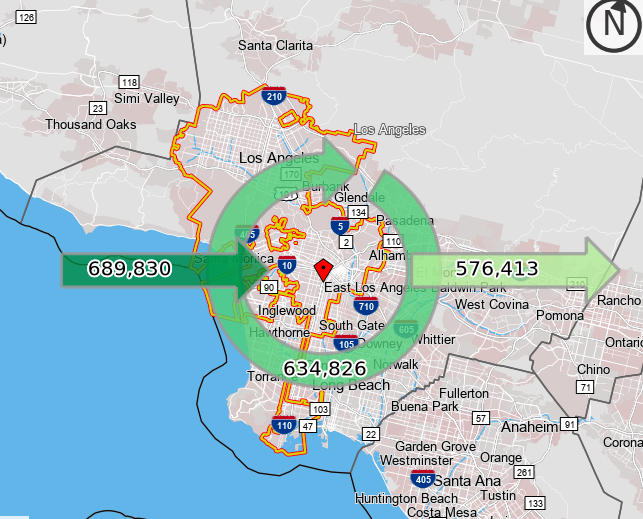
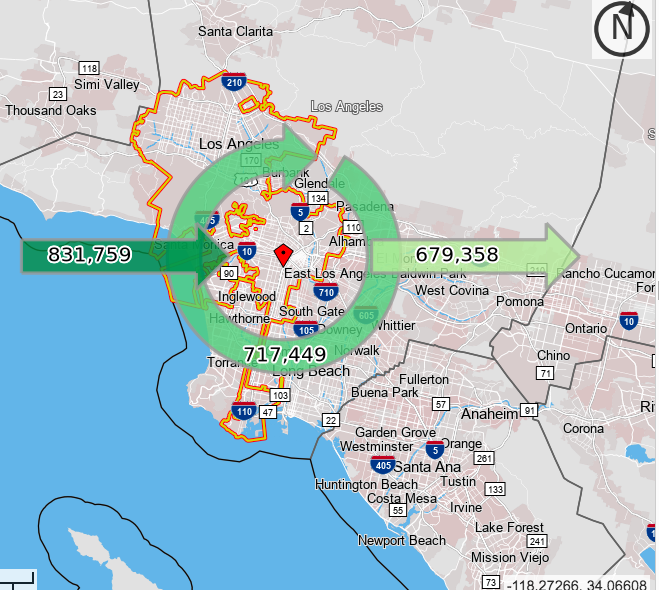
Given the information and infographics on public transportation above, it’s also important to consider the nature of who is coming into LA, who is leaving the city, and the intra city traffic in terms of getting to work. We have conducted analysis on the inflow and outflow of workers in the years 2002 and 2010. In both years, the prevailing highest number is the number of people coming into LA to work. The significance in the graphic above from OnTheMap, which sources it’s data from ACS, stresses the sheer traffic and lack of mobility going into, out of, and within LA on the average day.
Future Plans: Transportation

Image Source: https://s3-us-west-2.amazonaws.com/media.thesource.metro.net/wp-content/uploads/2014/10/10230124/15-0818_map_gm_underconst_v1.jpg

It’s important to understand how transportation has and will play a role in traffic and congestion trends, too. In a study done by the University of Minnesota on the number of jobs that can be reached within 30 minutes using transit. This is especially significant given the aforementioned study done on how longer commute times correlate with worse mental health. A major development that has contributed to improving this has been the expansion of the LA Metro lines. In the Go Metro Map from 2014 above, the dotted lines represent currently being constructed lines.
The completion of the Santa Monica to Downtown LA Expo line would increase the number of jobs that can be reached in 30 min or less along the orange arch on the left side of the choropleth map made by the University of Minnesota. Since the completion of the Expo Line Phase 2 in 2016, the Expo Line and the Gold Line are two of the Metro’s lines to maintain steady ridership, hitting their 2030 goal of 64,000 daily boardings in 2017. While the expansion of public transportation has never been built to completely solve congestion issues, it certainly helps. Given the information about the east of LA getting more dense in the population section of this paper, it makes it crucial that there is proper transit leading in and out of this area. With more people on public transit and less people on the streets, the number of collisions could go down.
Technology and Land Use Plan 2040
Image Source:
http://futuretechreport.com/hyperloop-future-transportation-technologies/
https://ladcp.maps.arcgis.com/apps/MapJournal/index.html?appid=2a05d2914ad94727a6f6c7ef2d3fc5ed
As population and businesses continue to grow, there must be changes in the way our daily lives operate in order compensate and improve. Although we know that the public transportation industry is getting better, it’s not enough to accomodate for most of the population to switch over. Currently, there is a proposal for a future transportation technology called the Hyperloop that connects Southern California to Northern California. The completion of this tranist is believed to significantly improve public transportation and in theory, improve the traffic congestion.
Additionally, the city of Los Angeles has released their general land use plan for 2040 in downtown LA. We can see that the land use is planned more strategically in which more of the city will be devoted to transit space. There are two large transit core areas in the above map that connects directly to both commercial (markets, production, industrial) land areas and public/civic areas. This will allow workers to come in from further parts of the city through public transit. The plan also accommodates for residential space by proposing a “multi-unit residential neighborhood”. Essentially, this will allow downtown LA workers to live closer to their work and reduce traffic congestion by a large margin.
Conclusion
An important overarching theme in our research and maps was the concept of mobility. Along with LA’s huge attractive factor of job opportunities comes with the impeding factor of mobility due to traffic congestion. In our work and research, we found the main factors of traffic congestion as well as solutions that are supported by ongoing efforts and historical data, all involving the same purpose of increasing mobility in some way shape or form. Given the increasing population density in the center, east, and south LA, the majority of workers coming into LA for work, and the housing pricing, there is an incredible demand for increased mobility. As Los Angeles moves towards its saturation point, there will only be more issues in congestion, traffic safety, and commuters’ personal mental healths. Some solutions to this issue would be improving public transportation and land use strategies. Focusing on public transportation will reduce the amount of vehicles on the road and more importantly, traffic congestion. Ultimately, reducing this impedance factor will allow the city of Los Angeles to grow economically and improve the quality of life for its residents.

